Data Visualization Services

Understand the Data in Simple Visual Format!

We transform complex data into easy-to-understand visuals, helping you grasp key insights quickly and make informed decisions without getting lost in the details.

Process

Our Data Visualization Process

At StatGlow, our data visualization process turns complex data into clear, actionable visuals. We follow a structured approach to ensure that every insight is presented in a way that is both meaningful and easy to understand.

StatGlow
StatGlow
1

Data Collection & Preparation

We start by collecting and cleaning your data, ensuring that it is accurate and well-organized before we begin the visualization process.

StatGlow
2

Visualization Design

Our team designs custom visualizations, including charts, graphs, and dashboards, tailored to your specific needs and goals to effectively convey the insights.

StatGlow
3

Review & Refinement

We review the visualizations with you, making any necessary adjustments to enhance clarity and ensure the visuals accurately represent the data insights.

Why StatGlow Leads in Data Visualization Solutions

At StatGlow, we excel in transforming complex data into compelling visuals that drive better decision-making. Our expertise, innovative design, and commitment to clarity ensure that your data speaks volumes, helping you see and act on insights like never before.

  • Tailored visuals for your specific needs.
  • Cutting-edge technology for high-quality visuals.
  • Clear and easy-to-understand data presentations.
StatGlow

25

Years of experience in startup building

Services

What’s Included in Our Data Visualization Services

StatGlow
StatGlow

 Interactive Dashboards

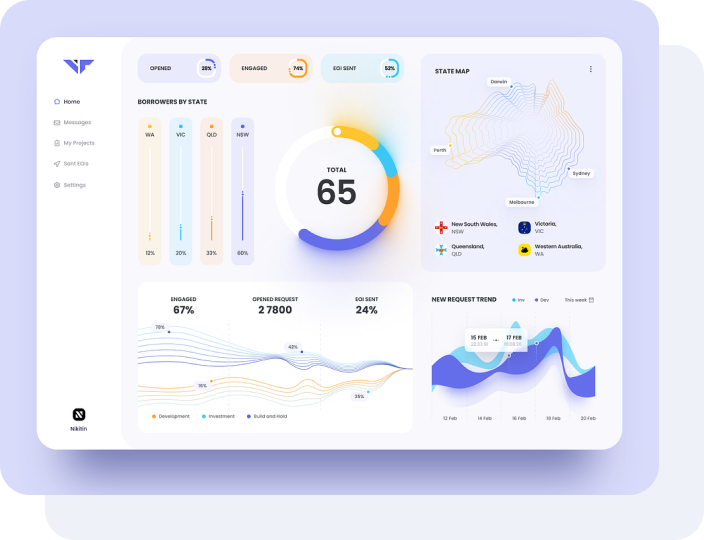
We create interactive dashboards that allow you to explore data in real-time, providing a flexible way to analyze and interpret complex information as it evolves.

  • Real-time updates
  • User-friendly interfaces
  • Custom filters
  • Drill-down capabilities
StatGlow

Custom Reports & Visualizations

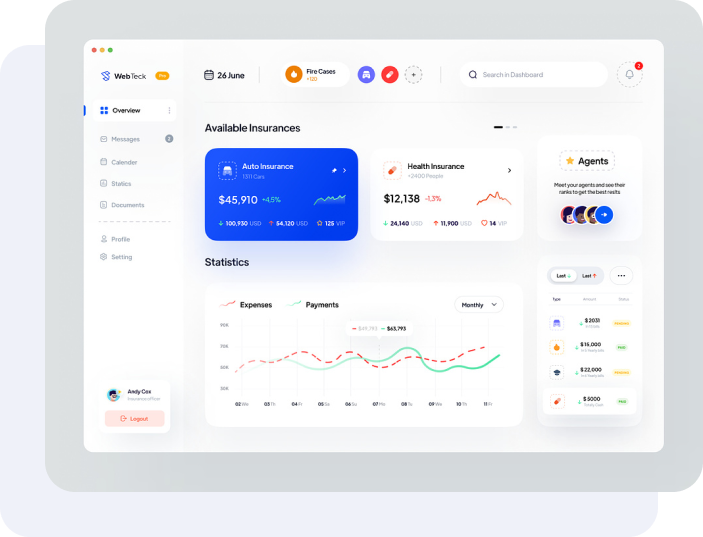
Our team designs custom reports and visualizations that highlight key metrics and trends specific to your business, making it easier to track performance and make informed decisions.

  • Personalized reports
  • Clear charts & graphs
  • Trend analysis
  • Visual storytelling
Call For More Info

Let’s Request a Schedule For Free Consultation

Industries

Industries We Serve with Data Visualization

StatGlow

Healthcare

We provide data visualization solutions that help healthcare providers monitor patient outcomes, streamline operations, and improve overall healthcare delivery with clear and actionable insights.

StatGlow

Retail

Our visualizations assist retail businesses in analyzing sales trends, tracking inventory, and understanding customer behavior, helping to boost sales and enhance the shopping experience.

StatGlow

Finance

We create detailed financial dashboards and reports that aid in financial planning, risk assessment, and performance monitoring, enabling better strategic decisions and financial management.

StatGlow

Manufacturing

Our data visualizations help manufacturers track production metrics, monitor supply chain performance, and optimize operations to reduce downtime and improve efficiency.

Project Success Stories

StatGlow

Major Insurance Provider Saves $750k per Month With Big Data Migration

The company needed to complete a complex migration on a tight deadline to avoid millions of dollars in post-contract fees and fines.

Learn More
StatGlow

major insurance provider to a big data cost savings of $750,000 is a significant

Project Success" is a broad term that can be interpreted in various ways depending on the context and the goals of a specific project.

Learn More
StatGlow

That's a significant achievement! Saving $750,000 per month through a big data migration

Project Success is a term that generally refers to the achievement of the goals and objectives set for a specific project.

Learn More
StatGlow

The headline Major Insurance Provider Saves $750k per Month With Big Data Migration

Project Success" is a broad term that can be interpreted in various ways depending on the context and the goals of a particular project

Learn More
Benefits

Why Data Visualization is Essential for Businesses

Data visualization is crucial for businesses because it transforms complex data into visual formats that are easy to understand and analyze. By presenting data through charts, graphs, and dashboards, businesses can quickly identify trends, make informed decisions, and communicate insights effectively.

  • Quick Insights
  • Improved Understanding
  • Enhanced Communication
  • Trend Identification
  • Informed Decision-Making
  • Data Accessibility
StatGlow
StatGlow WORK WITH US

Get Free IT Business Consultation Today. Feel Free To Contact!

We’re happy to answer any questions you may have and help you determine which of our services best fit your needs.

How We Works?
01

We schedule a call at for your service

02

Engage with clients understand their needs, and goals.

Please fill in the information below